Inside Blackwell NVL72: How Liquid Cooling Actually Works
By Gaurav Dhir
An NVL72 rack does not cool like 72 separate GPUs. It cools like one tightly packed system, with dozens of heat sources feeding the same liquid network.
Inside that rack are 36 Grace CPUs, 72 Blackwell GPUs, and 18 compute trays. Coolant runs through rack manifolds and into cold plates attached to the CPUs and GPUs. At this density, cooling is not a background service. It is part of the machine.
Think of the heat path as a relay. The package hands heat to the cold plate. Coolant carries it to the rack manifold. The CDU passes it to the facility loop. Sensors watch every handoff, because one weak branch can lose margin while the rest of the rack still looks normal.
Liquid cooling does not make heat disappear. It gives heat a shorter, denser, more measurable route out of the rack.
Two questions make the system easier to understand: where does the heat go, and what proves it is still moving? Keep those in mind and the whole rack becomes much less mysterious.
Subscribe to updates
Get the latest engineering perspectives sent straight to your inbox.
One rack, many heat sources
A GB200 Grace Blackwell Superchip pairs one Grace CPU with two Blackwell GPUs. Two Superchips sit in each compute tray, so the rack has 18 trays moving heat into the liquid loop at the same time.
That turns cooling into a coordination problem. Every tray needs enough flow, but no branch should steal pressure from its neighbors.
A 120 kW rack makes the scale easier to feel. This is a round-number planning example, not an NVIDIA design target. It shows why flow, pressure, filtration, and coolant chemistry have to be considered together.
The route is simple: chip, cold plate, coolant, manifold, CDU, facility loop. The hard part is keeping all tray branches close to their clean baseline while workloads change.
The cold plate shortens the trip
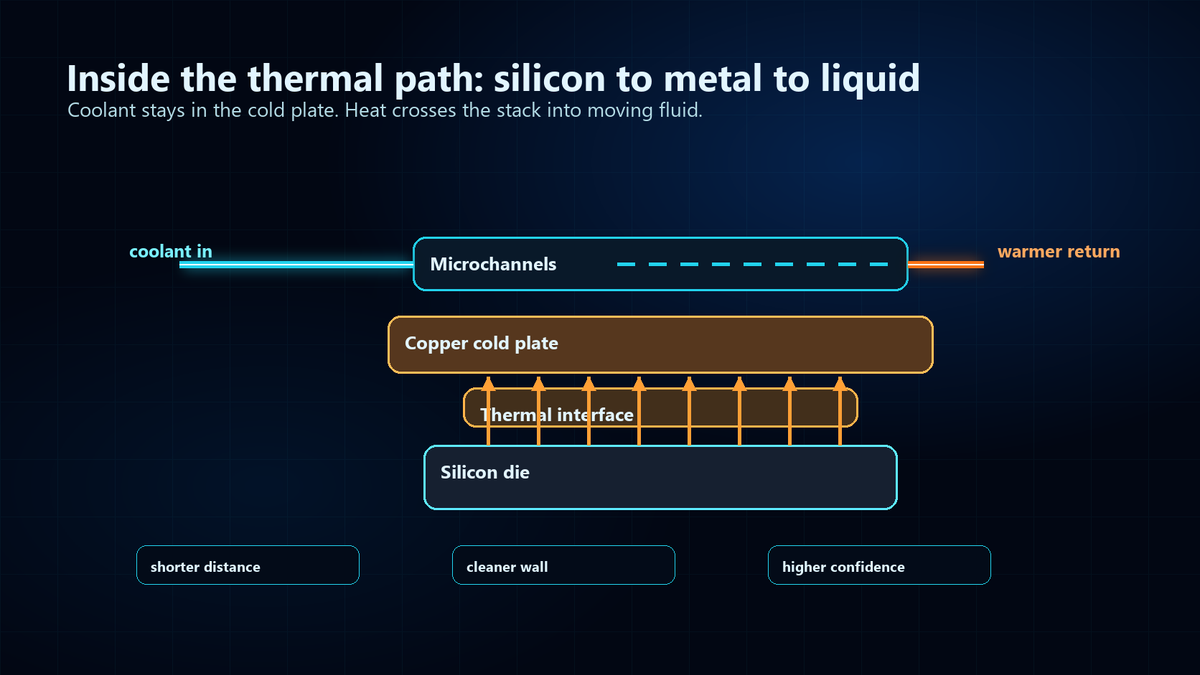
At the package, heat has a short but demanding trip to make. It leaves the silicon package, crosses the thermal interface, spreads into the cold plate, and enters moving coolant through internal channels.
Think of the cold plate as curbside pickup for heat. The package brings heat to the metal wall; moving coolant takes it away. If flow slows or deposits coat that wall, the queue grows and the package runs hotter.
The equation is simpler than the hardware: heat removed depends on coolant flow, heat capacity, and temperature rise. More flow can carry more heat, but flow is not free. Cold-plate channels, connectors, bends, valves, and loaded filters all consume pressure, and pumps pay for that pressure with power.
A quick scale check makes the point. If that 120 kW example were divided evenly across 72 GPU paths, each path would represent about 1.67 kW before accounting for CPUs, switches, supplier-specific cold plates, and pressure-drop choices. With water-like coolant and a roughly 6 C rise, the flow lands on the order of a few liters per minute per GPU path. That is not a published NVL72 design flow. It is a scale check.
That is why a small restriction matters. A degraded interface, fouled channel, trapped gas pocket, drifting chemistry, or loaded filter can steal thermal margin before a dramatic alarm appears.
What operators can actually see
Clear-looking coolant can still hide poor heat transfer. The useful picture connects package temperature, approach temperature, branch flow, pressure drop, pump effort, and coolant chemistry. Together, those signals show whether heat is crossing the cold-plate wall as easily as it did at commissioning.
Why the rack uses parallel flow
Do not picture one long hose visiting every GPU one after another.
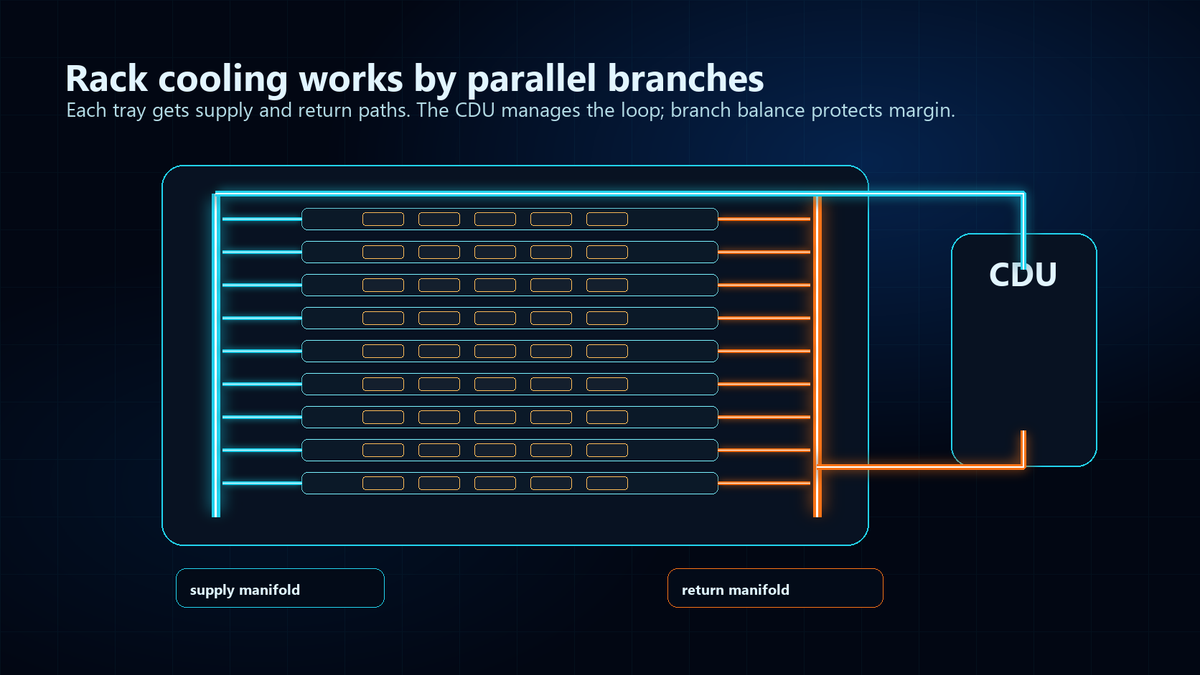
A serial path would stack pressure drop and coolant temperature rise from one device to the next. NVL72 instead uses rack manifolds: a supply manifold feeds parallel tray branches, and a return manifold collects the warmer coolant.
Picture a city water network, not a garden hose. Every branch needs enough flow, while every connector, bend, valve, cold plate, and filter spends part of the same pressure budget.
That is why changing pump effort matters. If a branch needs more pressure or pump command to deliver the same result it achieved at commissioning, something in that path has changed.
The question that catches drift earlier
Do not ask only whether the rack is below a temperature limit. Ask whether it is achieving the same thermal result with the same flow, pressure drop, pump command, coolant quality, and workload context as the clean baseline.
A temperature limit tells you whether the rack survived the moment. A baseline comparison tells you whether cooling is becoming harder.
Where the CDU hands heat to the building
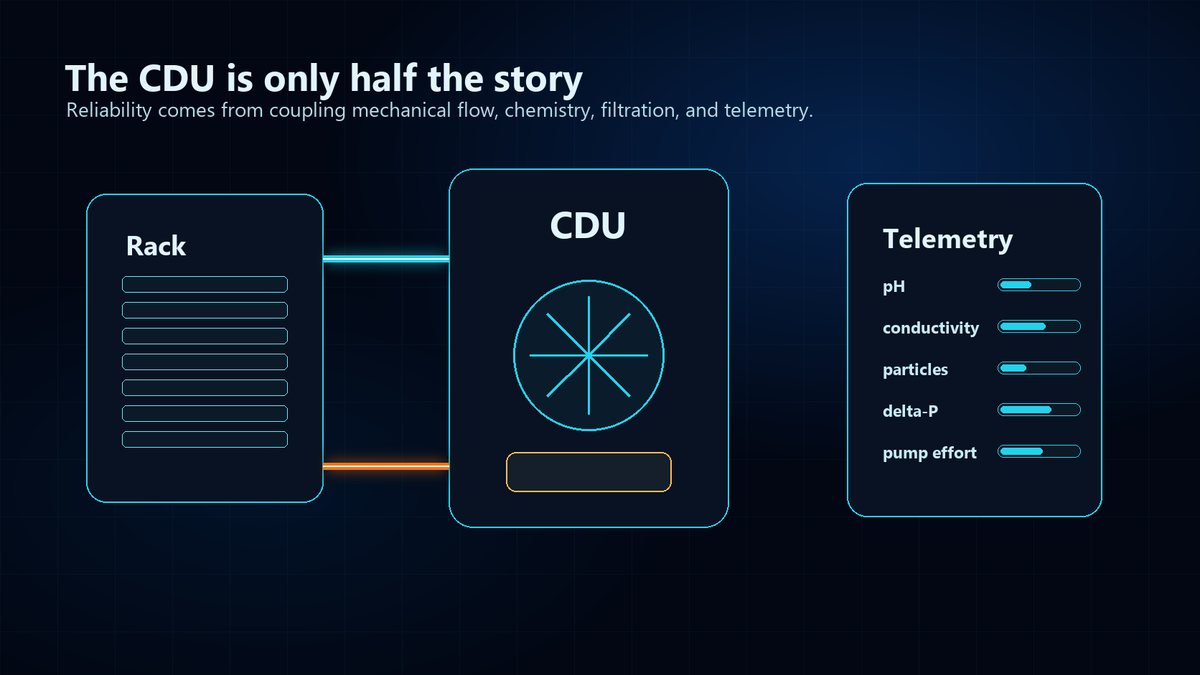
The coolant distribution unit, or CDU, is the handoff station between rack coolant and facility water. A liquid-to-liquid heat exchanger transfers energy across that boundary without mixing the two loops.
Keeping the loops separate matters. The facility side and rack side can use different materials, treatment programs, water-quality limits, and maintenance practices. The technology loop touches the hoses, quick disconnects, manifolds, filters, seals, and cold plates closest to the compute.
The CDU has four jobs: move fluid, move heat, protect hardware, and create evidence.
CDU and rack telemetry make that handoff visible. Temperature, flow, pressure, filter delta-P, conductivity, pH, particulate loading, leak status, and pump command show whether the heat path is still behaving like its clean baseline.
The loop can look calm while the evidence starts to move. Conductivity rises. A filter loads. Pump command creeps upward. No single change proves a failure, but a pattern deserves attention.
The loop can drift before the rack complains
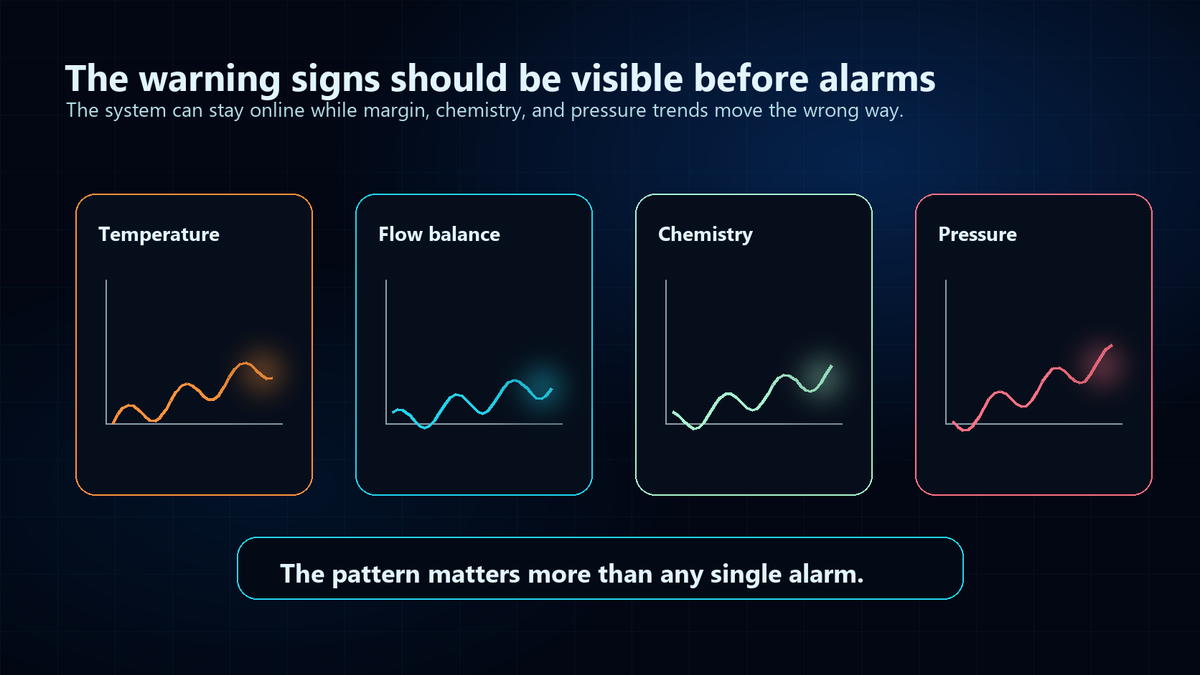
A leak or thermal shutdown is easy to notice. The higher-value win is catching drift while the rack still looks healthy and there is time to investigate.
Supply temperature may still look normal and the rack may stay online. Meanwhile, pump command rises, branch delta-P creeps upward, approach temperature widens, conductivity changes, or peer racks begin to separate under comparable load. That disagreement is the early warning.
OCP guidance recommends establishing a fluid baseline, trending conductivity and TDS, and investigating increases. Rising dissolved copper or iron can also point to active corrosion.
For treated water-based loops, the same guidance lists practical anchors including TSS below 5 ppm, TDS below 1000 ppm, conductivity below 1500 uS/cm at 25 C, low copper and iron, and pH between 8.0 and 10.5. Those are reference values, not universal NVL72 alarm limits. The OEM, fluid program, and site design still define the operating limits.
Filtration matters because cold-plate channels are tight. ASHRAE notes that a loaded filter can create far more pressure drop than a clean one. In a rack-scale loop, that can mean higher pump power, poorer branch balance, and less recoverable margin.
OCP recommends sidestream filtration below 5 microns and frequent filter checks during start-up and system changes. Filter delta-P therefore belongs beside temperature and flow in every operating review.
What to baseline on day one
- Workload context: model type, utilization, power draw, boost behavior, and scheduling state.
- Thermal state: GPU or package temperature, supply temperature, return temperature, and approach temperature.
- Hydraulic state: branch flow, rack flow, differential pressure, pump command, valve position, and filter delta-P.
- Fluid state: conductivity, TDS, pH, inhibitor status when applicable, turbidity, particulates, copper ions, iron ions, and biological control indicators.
- Service state: quick-disconnect events, hose or tray service, filter changes, flushing, fill events, and any chemistry correction.
Where the signals come from
The signals come from normal operating evidence: CDU telemetry, rack and tray sensors, facility conditions, and coolant lab results. OCP and ASHRAE help define what to baseline and trend. The OEM, fluid supplier, and site design define the actual limits.
| Signal | Where it comes from | What to record or watch |
|---|---|---|
| Rack load context | Scheduler, power telemetry, firmware records, CDU mode, valve state, and facility conditions. | Record workload, utilization, rack power, pump mode, valve state, ambient conditions, and facility supply conditions. Do not compare readings unless load and operating mode are comparable. |
| Supply / return coolant | CDU and rack-side temperature sensors. | Record clean supply and return at the chosen load. Watch for return or approach-temperature rise at the same load and flow. |
| GPU/package and approach temperature | GPU or tray telemetry combined with return coolant temperature. | Record steady-state package temperature and package-to-return approach temperature per tray or branch. Watch for widening approach temperature or trays separating from peer behavior. |
| Branch flow | Tray, branch, manifold, or commissioning balance data, depending on the installed design. | Record OEM nameplate flow and measured clean flow for each branch or tray. Watch branch imbalance and the worst branch over time. |
| Rack total flow | CDU flow telemetry, pump data, or facility-side commissioning records. | Record OEM rack total-flow requirement and clean measured flow at the pump command used for commissioning. Watch falling flow when pump effort rises. |
| Pump command | CDU controller telemetry. | Record the clean command required to hold target flow at the chosen commissioning load. Watch command drift for the same flow. |
| Filter delta-P | Differential-pressure taps or filter monitoring on sidestream and inline filters. | Record clean pressure drop, filter type, and service date. Watch delta-P rise together with branch flow and pump command. |
| Conductivity and TDS | Coolant sampling, inline sensors if present, and lab results. | OCP water-based guidance gives conductivity below 1500 uS/cm at 25 C and TDS below 1000 ppm after treatment. Track rate of rise from baseline. |
| Copper and iron ions | Coolant lab testing, typically ICP testing for soluble ions. | OCP gives copper ions below 0.2 ppm and iron ions below 0.1 ppm. Treat rising metals as corrosion evidence. |
| pH, solids, hardness, turbidity | Coolant sampling and lab results. | OCP gives pH 8.0 to 10.5, TSS below 5 ppm, total hardness below 30 ppm, and turbidity below 5 NTU. Watch pH shift, visible solids, discoloration, and increasing turbidity. |
Use this as a worksheet for an NVL72-class liquid-cooled rack, not as an NVIDIA specification. OEM documents define limits. The point is to keep the right signals in one place so teams can compare future drift against a clean starting point.
When to act
| Review state | What it means | Typical action |
|---|---|---|
| Baseline | Signals remain inside the commissioned band at comparable load and operating mode. | Keep trending. No immediate action. |
| Investigate | One or more signals move materially from the clean baseline. Example starting points: pump command +10 percentage points, filter delta-P +20 percent, conductivity +30 percent, approach temperature +3 C, or branch imbalance above 10 percent. | Check filters, coolant sample, trapped air, valve position, quick connects, and peer-rack behavior during the maintenance window. |
| Escalate | A signal moves quickly, multiple signals disagree, or the rack loses recoverable margin. Examples: branch imbalance above 15 percent, rising return or approach temperature while pump command is near max, metal ions above OCP values, leak indication, or sudden pressure loss. | Move to immediate inspection. Consider reduced load while isolating the branch, filter, chemistry, or CDU fault. |
Use this as a practical triage guide, not a manufacturer alarm table. Tune the final thresholds with OEM limits, commissioning data, fluid guidance, and site procedures.
Absolute limits can be reassuring and still miss the story. A temperature inside range may be getting worse quickly, or may now require more flow, more pump power, or a colder supply setpoint than it did last month. Trend and context matter as much as the number.
Follow the heat
The whole rack comes back to four handoffs: package to plate, plate to coolant, branches to manifold, and rack loop to facility loop. Sensors show whether those handoffs are staying efficient.
Do not wait for throttling or a hard alarm. Read the heat path, pressure path, and chemistry path together. When they stop agreeing, the rack is telling you where to look.
Subscribe to updates
Get the latest engineering perspectives sent straight to your inbox.
References
- NVIDIA GB200 NVL72 product overview
- NVIDIA Technical Blog: GB200 NVL72 training and real-time inference architecture
- NVIDIA Technical Blog: GB200 NVL72 designs contributed to Open Compute Project
- Open Compute Project: NVIDIA DGX GB200 product page
- ASHRAE TC 9.9: Water-Cooled Servers: Common Designs, Components, and Processes
- Open Compute Project: Water-based transfer fluid guidelines for single-phase cold-plate racks
- Open Compute Project: Propylene-glycol transfer fluid guidelines for single-phase cold-plate racks
- Open Compute Project: Liquid Cooling Cold Plate Requirements Document
- Open Compute Project: Cooling Environments project