Imagine you’re watching a coolant distribution unit as the racks pick up load. The rack-side reading climbs to 30 kW. Across the same exchanger, the facility side shows 22. If you’re signing off the test, what goes in the log? “8 kW difference at 14:02” is something you can defend. “The exchanger lost 8 kW” takes evidence those two numbers can’t give you.
What each side actually measures
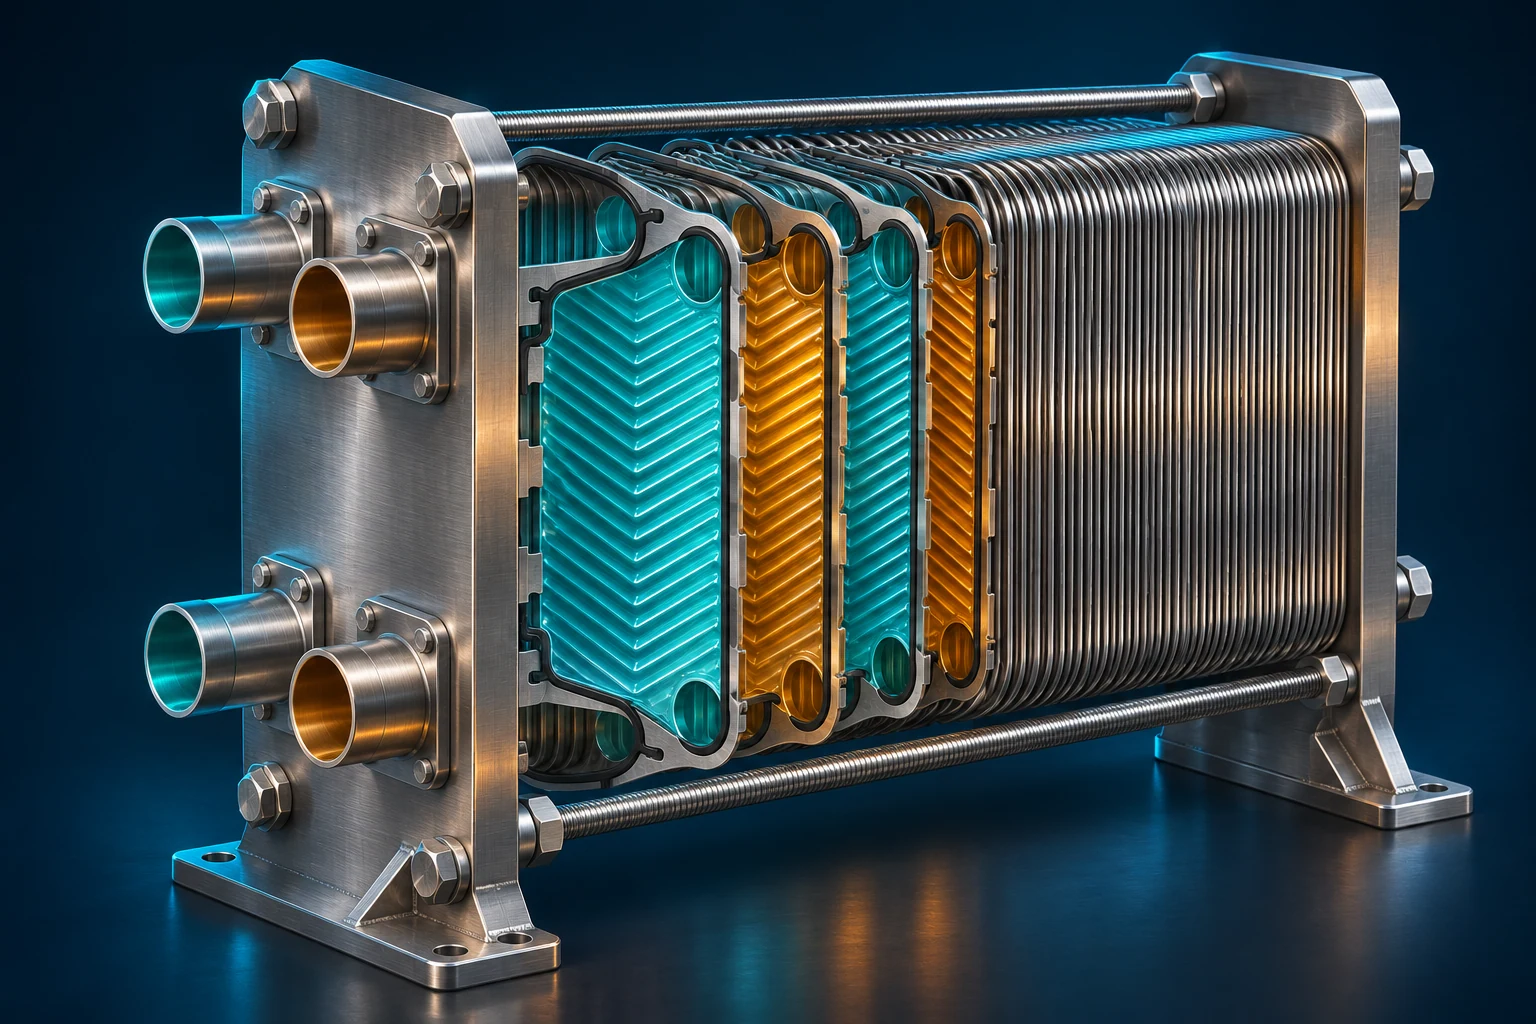
Follow the rack coolant first. It comes back warm from the equipment and leaves the exchanger cooler. On the other side of the plates, facility water enters cool and leaves warmer. The two liquids stay in their own circuits. Each calculation uses the flow and temperature change on its own side.
For water in this example, multiply mass flow in kg/s by 4.18 kJ/(kg·K) and by the temperature change in degrees Celsius to get kW. On the rack side use return minus supply. On the facility side use outlet minus inlet. If your meter gives litres per minute, convert to mass flow using the fluid density. If the circuit contains glycol, use its actual mixture and temperature to get density and specific heat.
Replay the nine minutes
These are illustrative readings. Start at 13:58, when both sides show 18 kW. Then choose 14:02 and look at the inputs behind the gap.
WORKED COMPARISON
Two heat estimates through one load change
Choose a snapshot. The inputs explain the number.
| Time | Rack circuit | Facility circuit | Rack / facility |
|---|---|---|---|
| 13:58 | 0.86 kg/s, 24 °C out, 29 °C back | 0.86 kg/s, 20 °C in, 25 °C out | 18 / 18 kW |
| 14:02 | 1.20 kg/s, 24 °C out, 30 °C back | 1.00 kg/s, 20 °C in, 25.3 °C out | 30 / 22 kW |
| 14:11 | 1.20 kg/s, 24 °C out, 30 °C back | 1.20 kg/s, 20 °C in, 26 °C out | 30 / 30 kW |
- Time
- 13:58
- Rack circuit
- 0.86 kg/s, 24 °C out, 29 °C back
- Facility circuit
- 0.86 kg/s, 20 °C in, 25 °C out
- Rack / facility
- 18 / 18 kW
- Time
- 14:02
- Rack circuit
- 1.20 kg/s, 24 °C out, 30 °C back
- Facility circuit
- 1.00 kg/s, 20 °C in, 25.3 °C out
- Rack / facility
- 30 / 22 kW
- Time
- 14:11
- Rack circuit
- 1.20 kg/s, 24 °C out, 30 °C back
- Facility circuit
- 1.20 kg/s, 20 °C in, 26 °C out
- Rack / facility
- 30 / 30 kW
At 14:02, the facility water is moving more slowly than the rack coolant and picking up 5.3 °C rather than 6 °C. That explains the arithmetic. It leaves a physical question open. Some heat can go into warming the liquid and metal during a ramp. A probe farther along the pipe can see the change later. A controller that averages over a minute can tell a different story from one that shows the latest sample.
Keep the original timestamps. Check where each probe sits and how each channel is averaged before lining up the traces. Moving one curve until the two overlap would throw away the delay you’re trying to understand.
What if the gap stays?
By 14:11, the facility calculation is 1.20 × 4.18 × 6.0 = 30.1 kW. Here’s a quick way to judge whether a temperature reading deserves a closer look. Keep the flow and inlet fixed and change the outlet reading from 26.0 °C to 25.1 °C. The result drops to 25.6 kW. Less than one degree has moved the answer by 4.5 kW.
If the readings stay apart under steady load, compare the raw controller temperatures with the historian, trace the probes to the actual ports and check the temperature pair against a suitable reference. Record the flow, fluid mixture and any bypass inside the measurement boundary. The calculation tells you how much an input matters. The checks tell you whether it’s wrong.
One more reading before sign-off
Look back at 14:11. Both sides carry about 30 kW, but the racks are still receiving water at 24 °C. With facility water entering at 20 °C, the approach temperature is 4 °C. Compare that value with the agreed requirement at this load, flow and fluid mixture. Two matching duty readings settle the heat-rate comparison. The rack supply temperature answers a different question your customer will ask.
References
Open Compute Project, Liquid to Liquid CDU Test Methodology and Performance Rating, §3.3.2.1. Defines approach temperature and shows how to report it alongside load and circuit conditions.
Vertiv, CoolChip CDU 100 kW Operation and Maintenance Guide, §4.2.3. The status screen gives a hardware example of separate primary and secondary duty readings.
U.S. Department of Energy, Thermodynamics, Heat Transfer, and Fluid Flow, vol. 1, module 1. Covers specific heat, mass flow and stored energy in a control-volume balance.