The GPUs Are Hotter. Is the Cooling Loop to Blame?
GPU temperatures are climbing. The coolant distribution unit says its supply temperature is right on target. Which reading should you believe?
Both can be correct.
Perhaps the GPUs are simply doing more work. Perhaps one rack is getting less flow. Perhaps the facility has less room to reject heat. The same temperature rise can lead to very different maintenance decisions.
Before changing a setpoint or calling for more pump speed, ask a better question: what changed first, and where was it measured?
Watch one workload change travel through the loop
Play the sequence below. Follow the change from GPU power to rack return and then to the CDU. Notice that the readings do not move together. This is an illustrative sequence, not a prediction of response times.
The heat moves. The readings follow.
Press play to follow one workload change through the system.
The CDU return combines several racks. Its smaller, later change can hide what happened at one rack.
The useful takeaway: a steady CDU supply temperature does not tell you whether every rack is receiving enough cooling.
GPU power can change before warmed coolant reaches a return sensor. A rack sensor sees its connected equipment. The CDU return combines several racks, which can make one rack's change appear later and look smaller.
Meanwhile, the controller may be doing exactly what it should: adjusting a facility-side valve to hold the rack coolant supply near its setpoint. A pump holding differential pressure will not necessarily respond like a pump holding flow. Check the configured mode before judging the trend.
Why this matters as AI workloads move
At the AI Infra Summit on September 15, NVIDIA described software that reallocates power across GPUs and racks, responds to grid signals and buffers short power spikes. Its DSX MaxLPS and DSX Flex announcements put more attention on how AI infrastructure uses power.
For cooling teams, the consequence is practical: when work moves, heat moves with it. The question is whether the cooling response is expected or whether performance has changed.
NVIDIA's MaxLPS documentation also separates two design duties. It recommends sizing local rack-side cooling for MaxP, the highest GPU power setting, while sizing the facility water loop for MaxQ, a lower-power operating setting. A local peak and the whole site's operating envelope are not the same thing.
That distinction makes rack-level evidence important. It does not mean a workload ramp is itself a cooling fault.
Find the sensor before trusting the comparison
A CDU supply reading answers one question: what temperature is leaving that unit at that sensor? It does not measure flow through each branch or heat transfer inside a particular cold plate.
Select a measurement point in the diagram. Watch which part of the system it can describe, and which questions it leaves open.
Heat crosses.
The fluids stay separate.
Two closed circuits. One heat exchanger. Choose a measurement location to see what it can tell you.
Start with the chip. Keep following the heat.
- Tells you
- Temperature and power show the GPU response to its workload.
- Does not tell you
- They do not measure coolant flow or identify where heat removal changed.
- At the GPU: power, temperature and clock-event reasons tell you how the chip is operating. They do not directly measure coolant flow.
- At the rack, where sensors are fitted: supply, return and branch flow connect a local heat load with local cooling.
- At the CDU: total flow, temperatures, pump operation and differential pressure describe the combined loop.
- On the facility side: water supply, flow and control-valve response help explain whether heat can leave the rack circuit.
In a liquid-to-liquid CDU, rack coolant and facility water exchange heat without mixing. Keep their readings on the correct side of the heat exchanger. If branch flow is not measured, leave it marked as missing. An estimate should not quietly become a sensor reading.
Three explanations, three different next checks
Start with the work log. A pump changeover, revised power limit, setpoint adjustment, maintenance visit or another rack changing load may explain the step. Then compare these three possibilities.
More work, with cooling behaving as expected
GPU power rises, temperature follows, and both settle. Rack flow and supply remain consistent with the earlier operating condition.
Look for a previous ramp on the same hardware at similar power, workload, flow and supply temperature. That is a more useful comparison than the GPU next door.
One trap: a temperature plateau is not automatically good news. A GPU may have reduced its clocks to protect itself. Include thermal clock-event reasons before calling the response normal.
Less flow reaching the rack
The GPU is hotter at similar power, and measured branch flow is below its matched baseline. The local return-to-supply temperature difference may grow too.
Total CDU flow can hide one restricted branch. A controlled differential pressure can also stay on target while the distribution of flow changes.
Check the branch data alongside filter differential pressure, recorded valve positions and recent work. Pump speed alone cannot locate a restriction. Do not move live-loop valves or open vents to test a theory; use the approved equipment and site procedure.
Less heat getting out
Coolant supply is warming despite strong cooling demand. Check facility supply conditions and CDU response. A valve near the end of its travel may point to limited remaining capacity, warmer facility water or a performance problem. It does not tell you which one.
There is a different pattern worth separating: a GPU gradually runs hotter at comparable power, flow and supply temperature. Here the heat-transfer path deserves attention, including the cold plate, interfaces and fouling. Turning up the pump is not a diagnosis.
Our article on the cooling penalty from a thin fouling film explains one possible mechanism.
Compare the evidence below. For each case, look for the next measurement that would strengthen or weaken the explanation.
Same hotter GPU. A different investigation.
Choose an explanation. Compare the evidence that would support it.
GPU power
HigherChanged conditionRack flow
SteadyComparison conditionCoolant supply
SteadyComparison conditionPower changed. The cooling readings stayed similar.
A short workload ramp does not establish a coolant chemistry failure. Bulk degradation usually takes longer. But a recent refill, contamination event or unusual fluid measurement still belongs in the investigation.
Check that your clocks tell the same story
Before comparing traces, align the workload-change timestamp with the GPU, building-management and CDU records. Check time zones, collection intervals and averaging periods.
NVIDIA's dcgm-exporter collects at a 30-second interval by default. A short event can fall between observations. A detailed GPU trace does not repair a slower or misaligned CDU record.
Pipe volume divided by volumetric flow gives a nominal transport timescale for a simple path. It is not a countdown to a settled system: mixing, thermal mass, control response and sensor lag affect the result. Use the site's observed response to judge when a comparison is meaningful.
Use the heat balance once conditions settle
At settled conditions, cross-check the liquid-side heat-removal rate:
Mass flow rate × specific heat × return-to-supply temperature rise.
Use properties appropriate to the single-phase coolant and measurements around the same boundary, with negligible other heat gains across that section. A CDU calculation covers the racks it serves, not one selected GPU.
During a ramp, some energy is still warming equipment and fluid. The downstream sensor also sees coolant that left the upstream point earlier. An instantaneous mismatch with electrical power need not mean a failure.
Nor does every electrical watt necessarily enter the liquid circuit. NVIDIA's GB200 reference architecture liquid-cools the most power-intensive components while retaining air cooling elsewhere. A useful heat balance respects that boundary.
Leave the next shift a decision, not a screenshot folder
Keep the event record short enough that someone will use it:
- What changed? Name the rack or GPU, symptom and timestamp.
- Under what conditions? Record workload, power limit, supply temperature, flow, pump mode and recent work.
- What can we trust? Note sensor locations, clock alignment, collection intervals and missing signals.
- What still fits? Keep the evidence for and against each explanation.
- What happens next? Name the check, its owner and the decision it can support.
Download the comparison worksheet to keep these details together, including confidence and escalation notes.
Do not wait for a completed worksheet when limits are approached, thermal slowdown appears, flow leaves the approved range or a leak, pressure or pump alarm occurs. Follow the site response.
This week: Singapore and Las Vegas
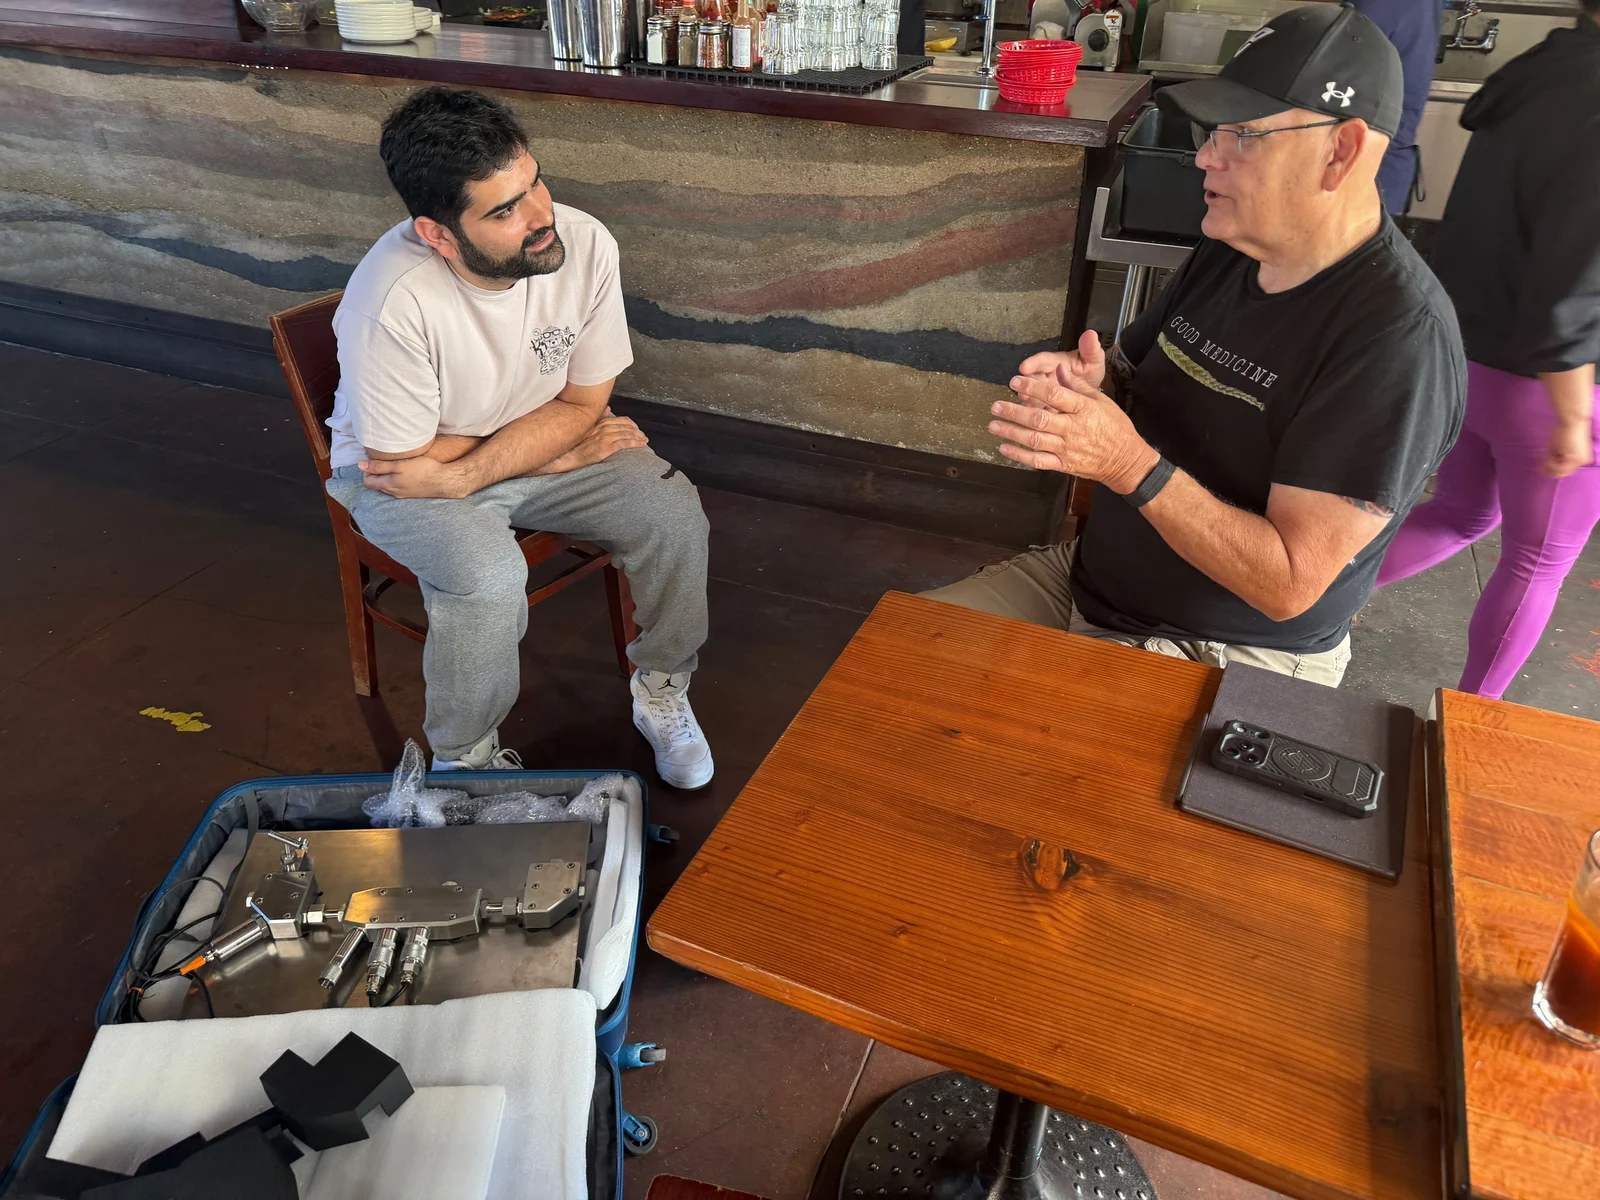
Brenda Pak represented Reliability Engine at Data Centre World Asia in Singapore on September 29 and 30. Gaurav Dhir attended Yotta 2026 in Las Vegas from September 28 to 30.
Two cities, one focus for our team: making liquid-cooling performance easier to understand as AI infrastructure grows. These photographs accompany the team's travels.

Make the next check count
Reliability Engine's thermal orchestration approach brings temperature, pressure, flow, coolant condition and workload context into the same investigation.
The goal is a specific next action. Verify the timestamp. Check the branch. Review heat rejection. Or establish that the warmer GPU is responding as expected to more work.
A hotter GPU is a reason to look closer, not a diagnosis. The right comparison tells you where to look next.
Talk to Reliability Engine about your liquid-cooling evidence.
Subscribe to updates
Get the latest engineering perspectives sent straight to your inbox.
References
- NVIDIA: AI Infra Summit announcements on Vera Rubin and DSX, September 15, 2026.
- NVIDIA: DSX MaxLPS overview and facilities-design FAQ, accessed September 28, 2026.
- Vertiv: CoolChip CDU 600/1350 guide specifications, 2025, sections 2.4 to 2.6 and 3.6.
- NVIDIA: dcgm-exporter collection settings, accessed September 28, 2026.
- NVIDIA: NVML clock-event reasons, accessed September 28, 2026.
- MIT OpenCourseWare: residence-time distributions and nominal hydraulic residence time, lecture 4, pages 15 to 19.
- MIT: heat exchangers and liquid-side energy balances, section 18.5, accessed September 28, 2026.
- NVIDIA: DGX SuperPOD GB200 key components, accessed September 28, 2026.